ESP32 → MQTT → Node-RED → InfluxDB → Grafana Dashboard
ESP32 → MQTT → Node-RED → InfluxDB → Grafana Dashboard
This project demonstrates a complete IoT data pipeline using an ESP32 running MicroPython, sending random sensor values via MQTT to Node-RED, which stores the data in InfluxDB and visualizes it in Grafana.
🧭 Contents
- Architecture
- Prerequisites
- 1) Flash & run ESP32 code (MicroPython)
- 2) Node-RED flow (MQTT → InfluxDB)
- 3) InfluxDB 1.x setup & quick test
- 4) Grafana: add data source & dashboard
- 5) Verification
- 6) Troubleshooting
ESP32 (MicroPython)
└── publishes random ints → MQTT topic: /aupp/esp32/random
└── MQTT broker (test.mosquitto.org:1883)
└── Node-RED (MQTT In → Function → InfluxDB Out)
└── InfluxDB (measurement: random, field: value, tag: device)
└── Grafana (InfluxQL queries + auto refresh)
⚙️ Prerequisites
Hardware
- ESP32 board (any variant supporting MicroPython)
Software
- MicroPython flashed on ESP32 (Upload scripts using Thonny, mpremote, or ampy)
- Node-RED Local automation server. Accessible at: http://localhost:1880
- InfluxDB 1.x. Time-series database Running at: [http://127.0.0.1:8086 (http://127.0.0.1:8086)
- Grafana — Visualization dashboard. Accessible at: http://localhost:3000
Optional Tools
- MQTT Explorer — inspect and debug MQTT topics
⚙️ Installing Node-RED (Local Setup)
Node-RED is a flow-based tool for wiring together hardware, APIs, and online services — perfect for IoT projects like this one.
🧩 Option 1 — Install via npm (recommended for Windows, macOS, Linux)
📦 Node-RED requires Node.js ≥ 14 and npm installed first.
Download Node.js from https://nodejs.org.
- Open Terminal (macOS/Linux) or PowerShell (Windows).
- Install Node-RED globally:
npm install -g --unsafe-perm node-red - Start Node-RED
node-red - Once started, open your browser and go to:
http://localhost:1880🗄️ Installing InfluxDB (v1.x)
InfluxDB is a time-series database used to store sensor and IoT data efficiently.
💡 This project was tested with InfluxDB v1.12.2 (InfluxQL syntax).
Official downloads: https://portal.influxdata.com/downloads/
🧩 Windows Installation
- Open PowerShell as Administrator and start the server:
wget https://download.influxdata.com/influxdb/releases/v1.12.2/influxdb-1.12.2-windows.zip -UseBasicParsing -OutFile influxdb-1.12.2-windows.zipThen
Expand-Archive .\influxdb-1.12.2-windows.zip -DestinationPath 'C:\Program Files\InfluxData\influxdb\' - In a PowerShell window, open the Influx shell:
cd "C:\Program Files\InfluxData\influxdb" .\influxd.exe - In a new PowerShell window, open the Influx shell:
cd "C:\Program Files\InfluxData\influxdb"
.\influx.exe -host 127.0.0.1
📊 Installing Grafana
Grafana is a powerful visualization platform for time-series data such as InfluxDB metrics.
💡 This project uses Grafana v10+ and InfluxQL as the query language.
Official downloads:
🔗 https://grafana.com/grafana/download
🧩 Windows Installation
Download the Windows installer (
grafana-enterprise-<version>.windows-amd64.msi)
👉 Grafana Download for WindowsRun the installer (accept defaults).
Grafana will be installed as a Windows Service and starts automatically.- Verify the service is running:
- Press Windows + R, type
services.msc, press Enter. - Locate Grafana (or Grafana Enterprise).
- If not running → right-click → Start.
Or, from PowerShell (Admin): ```powershell net start grafana
- Press Windows + R, type
- Open Grafana in your browser:
http://localhost:3000Default login:
Username: admin
Password: admin
🔧 Step 1 — ESP32 MicroPython Code
Flash and run this code on your ESP32 (e.g., using Thonny):
import network, time, random
from umqtt.simple import MQTTClient

SSID = "TP-LINK_56C612"
PASSWORD = "06941314"

BROKER = "test.mosquitto.org"
PORT = 1883
CLIENT_ID = b"esp32_random_1"
TOPIC = b"/aupp/esp32/random"
KEEPALIVE = 30

def wifi_connect():
    wlan = network.WLAN(network.STA_IF)
    wlan.active(True)
    if not wlan.isconnected():
        print("Connecting to WiFi...")
        wlan.connect(SSID, PASSWORD)
        t0 = time.ticks_ms()
        while not wlan.isconnected():
            if time.ticks_diff(time.ticks_ms(), t0) > 20000:
                raise RuntimeError("Wi-Fi connect timeout")
            time.sleep(0.3)
    print("WiFi OK:", wlan.ifconfig())
    return wlan

def make_client():
    return MQTTClient(client_id=CLIENT_ID, server=BROKER, port=PORT, keepalive=KEEPALIVE)

def connect_mqtt(c):
    time.sleep(0.5)
    c.connect()
    print("MQTT connected")

def main():
    wifi_connect()
    client = make_client()
    while True:
        try:
            connect_mqtt(client)
            while True:
                value = random.randint(0, 100)
                msg = str(value)
                client.publish(TOPIC, msg)
                print("Sent:", msg)
                time.sleep(5)
        except OSError as e:
            print("MQTT error:", e)
            try:
                client.close()
            except:
                pass
            print("Retrying MQTT in 3s...")
            time.sleep(3)

main()
This will generate the topic of: /aupp/esp32/random
🧩 Step 2 — Node-RED Setup
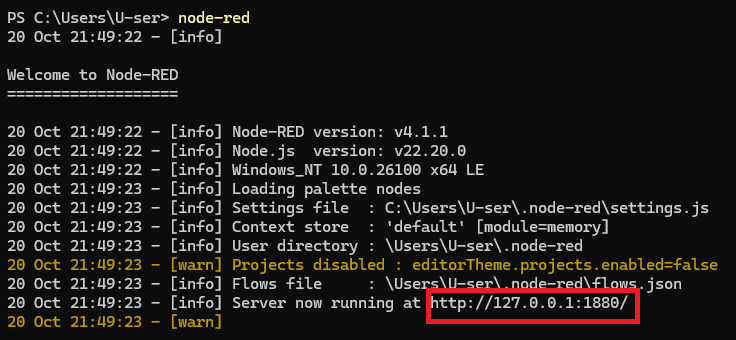
- Go to powershell and type:
node-redAfter that you will see the server is running. So, you need hold the CTRL button and click on the server as shown in the image below
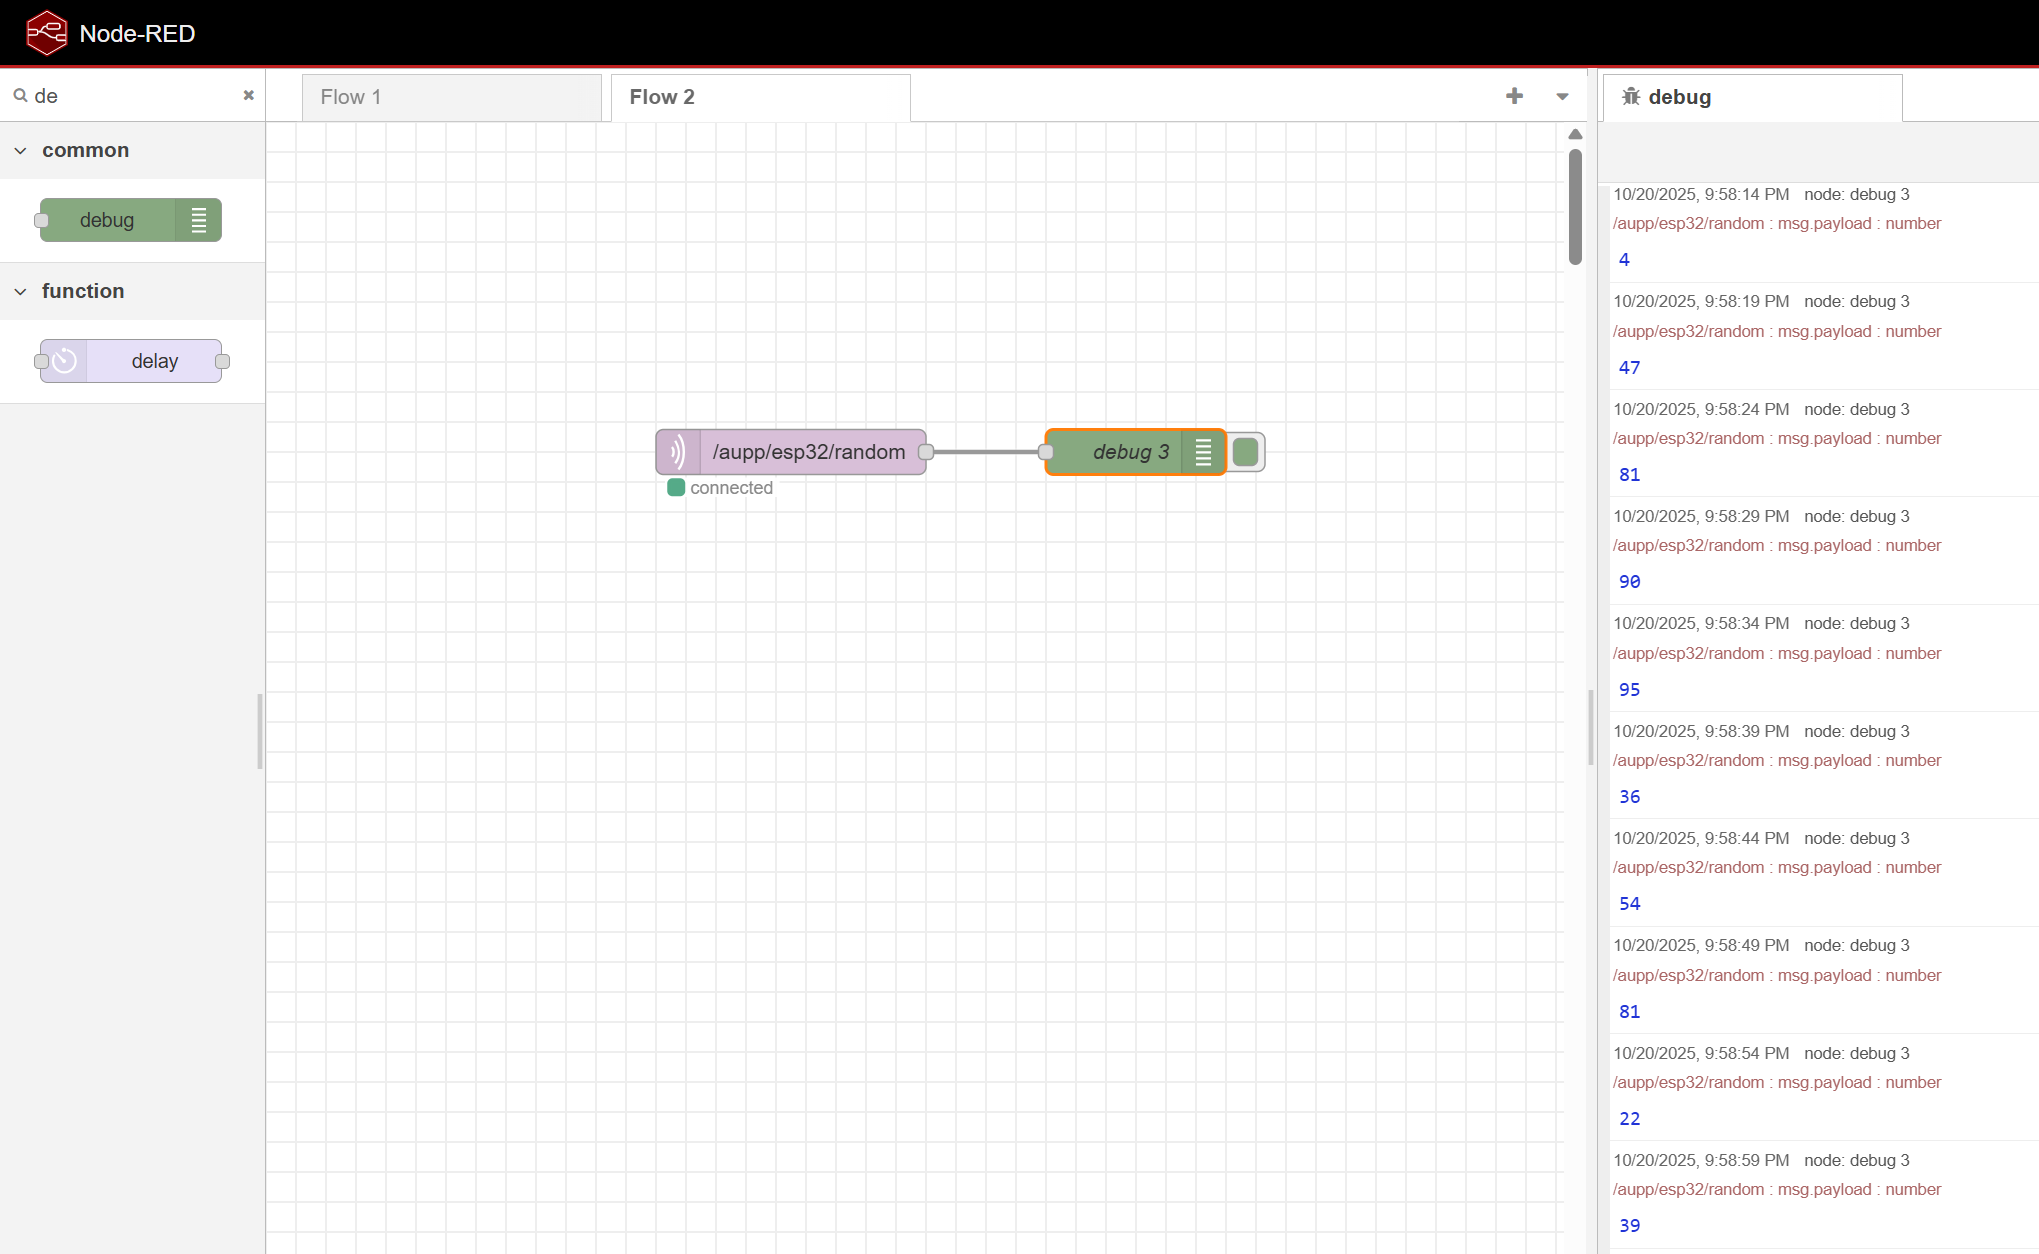
- Then in the Node Red, add the mqttin and the debug in order to verify the data in the node red
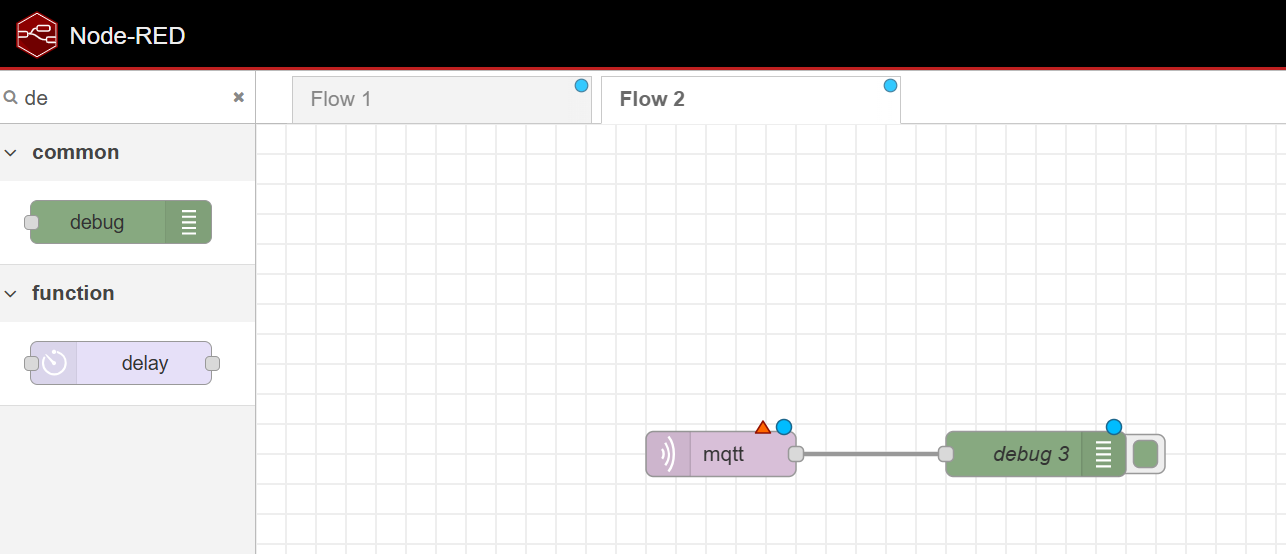
- Click on the mqtt and change the parameter as shown in the image below
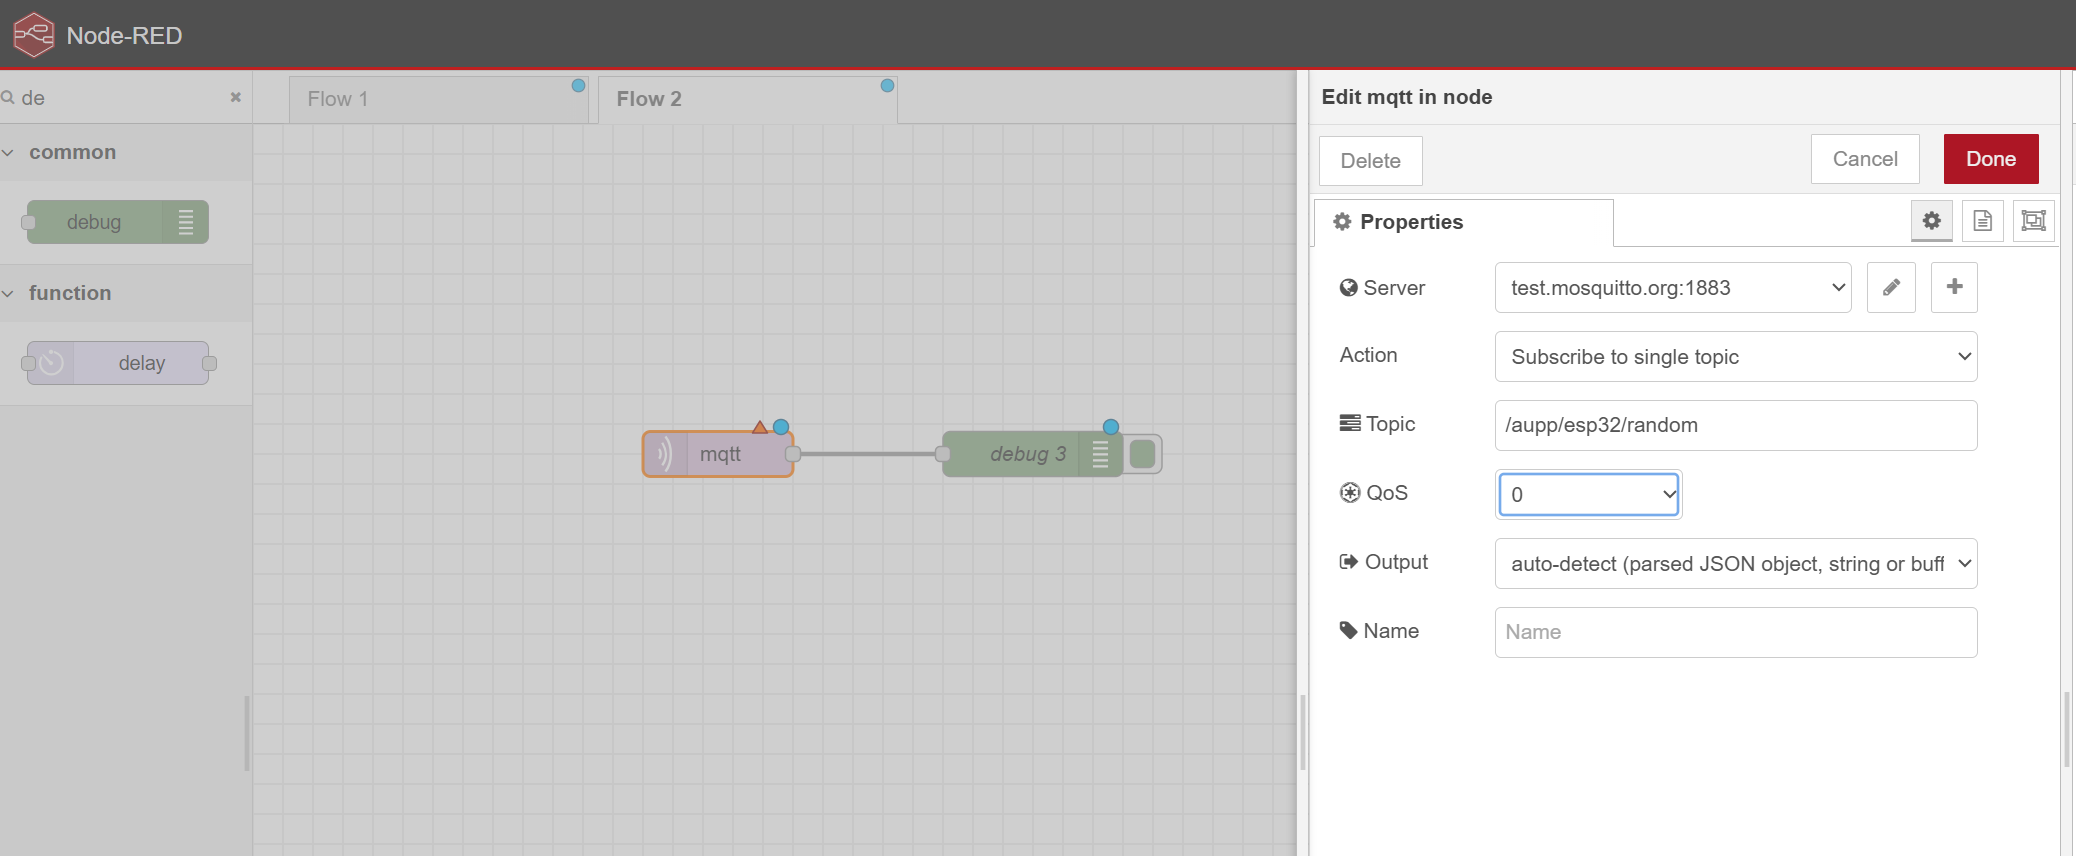
- Click deply and check the debug you will see the random value on the right of the image
🗄️ Step 3 — InfluxDB Setup
- Start InfluxDB:
cd "C:\Program Files\InfluxData\influxdb" .\influxd.exe - Open a new PowerShell window:
cd "C:\Program Files\InfluxData\influxdb"
.\influx.exe -host 127.0.0.1
In the Node Red, install the influxDB
-> Open Node-RED → ☰ Menu → Manage palette → Install
-> Search: node-red-contrib-influxdb
-> Click Install.
You’ll get two nodes in the left palette:
InfluxDB out (write to Influx)
InfluxDB in (query Influx)
- After That, config the node-red with influxDB,
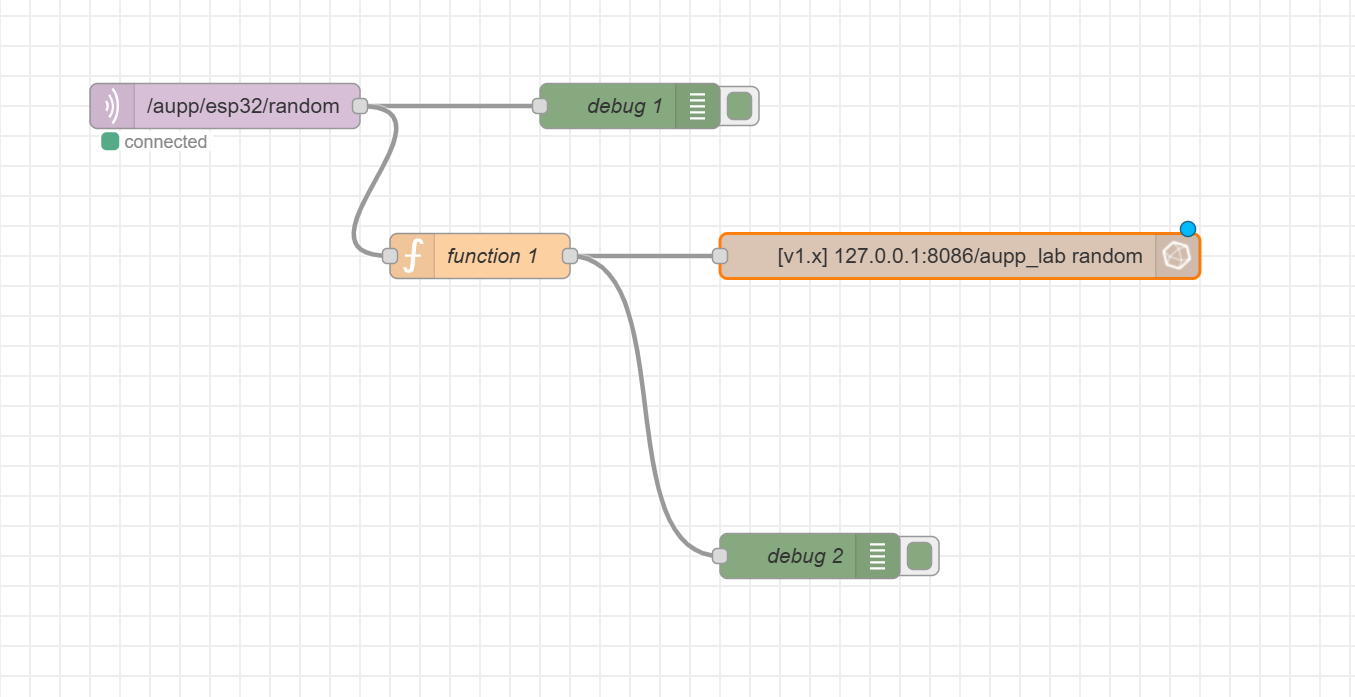
- In the Function block add the code below
msg.measurement = "random";
msg.payload = { value: Number(msg.payload) };
return msg;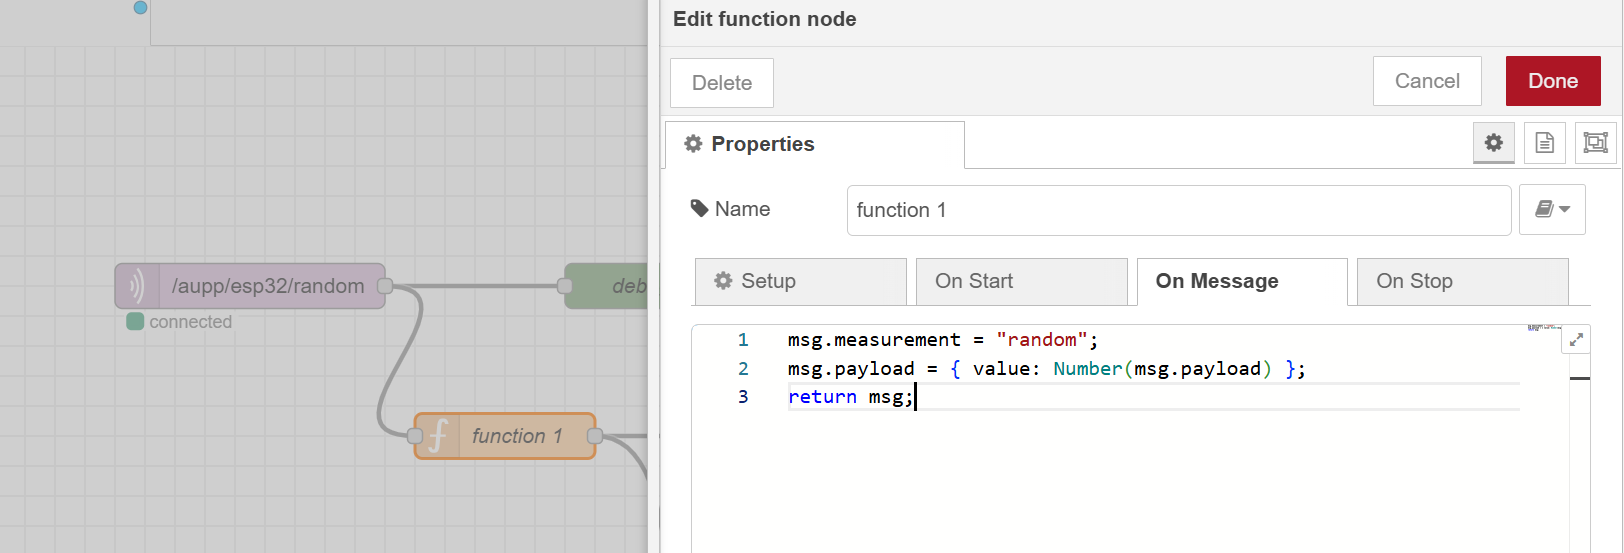
- In the InfluxDB out you need to add the measurement and the data as shown in the image below
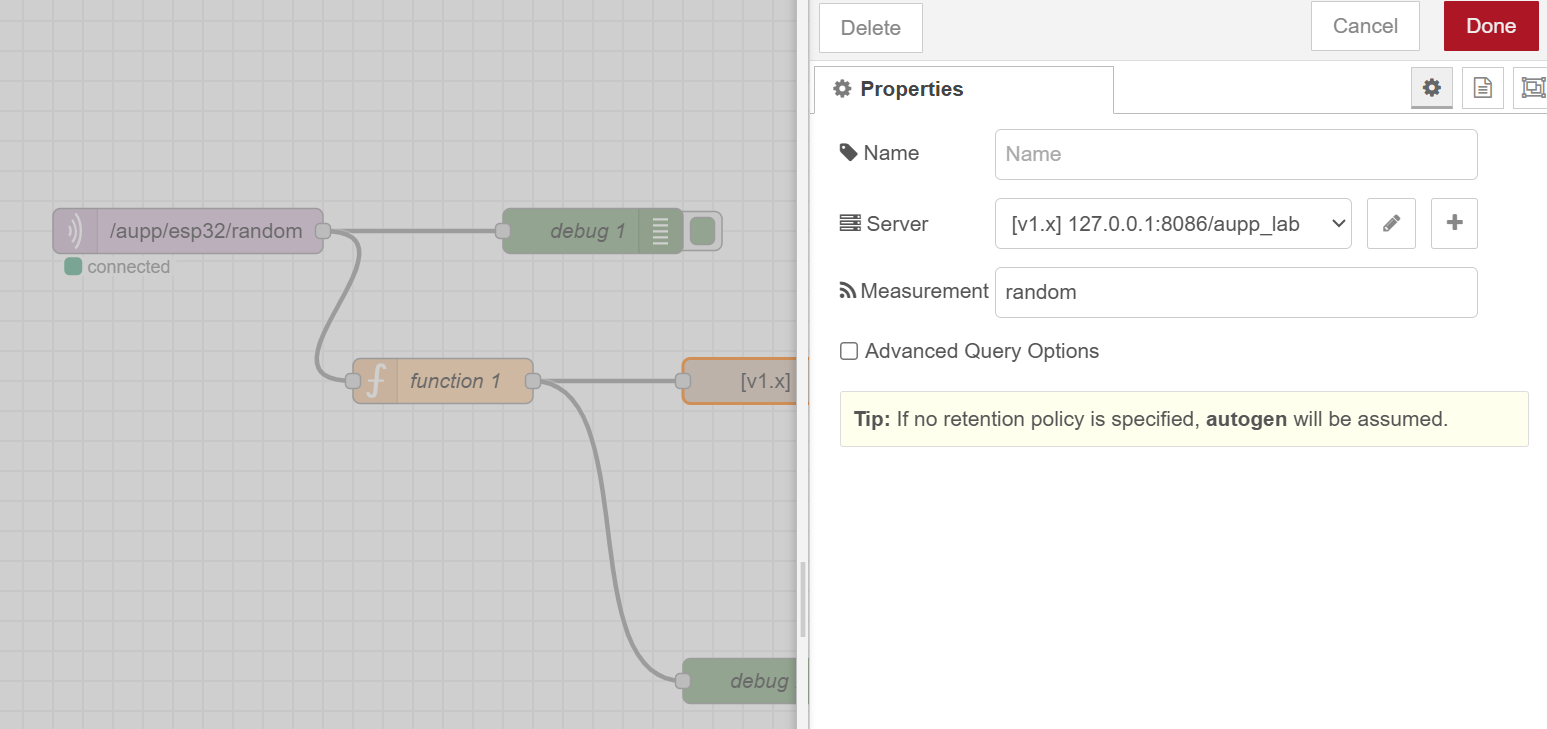
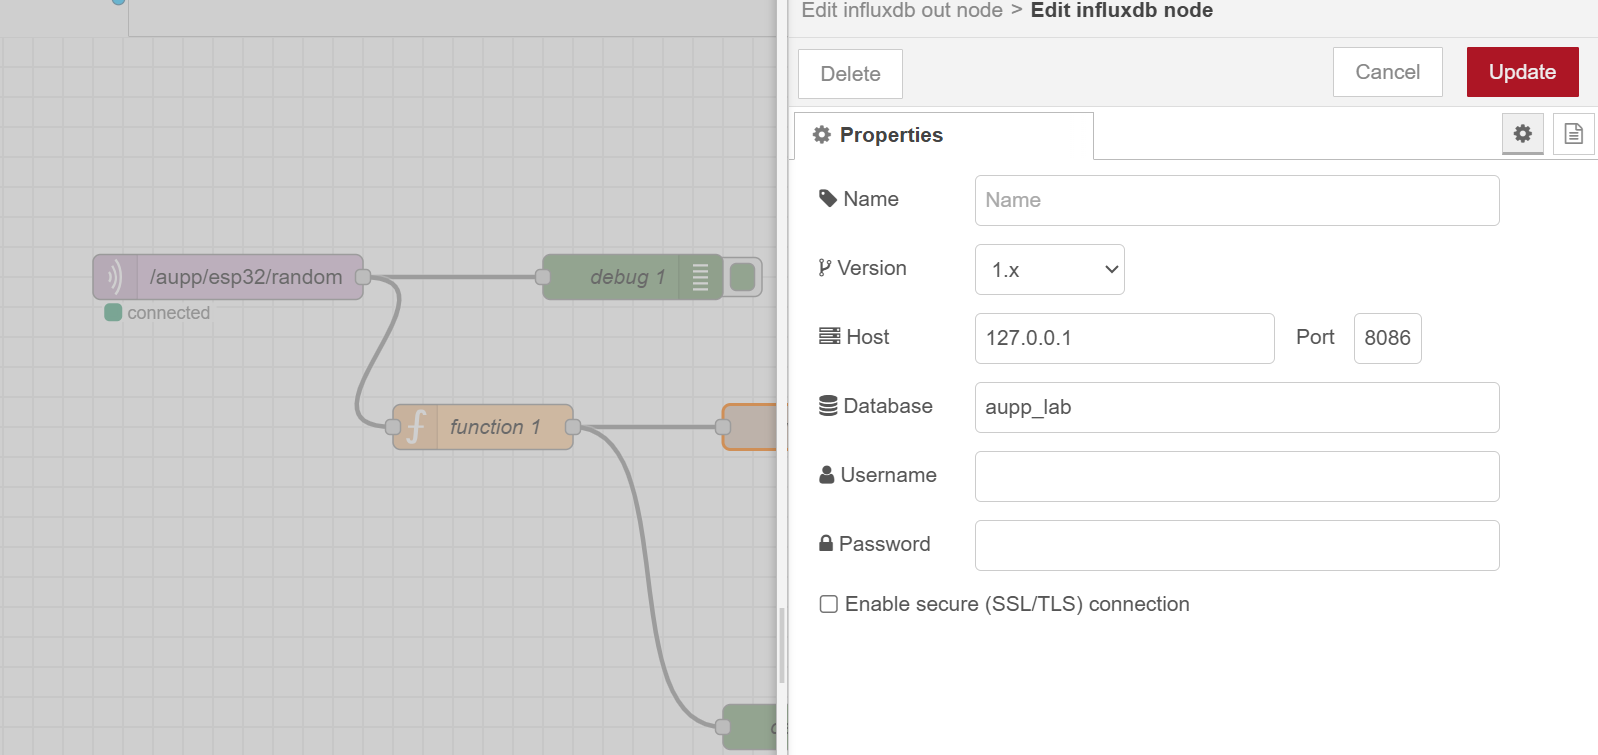
- Then click deploy
- In the influxDB powershell, you need to create a database for Node-RED
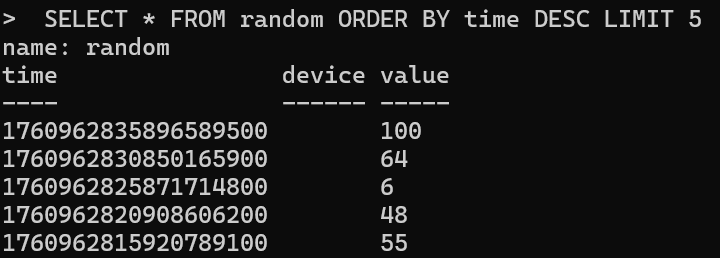
CREATE DATABASE aupp_lab;
SHOW DATABASES;
USE aupp_lab;
– Then you do
SELECT * FROM random ORDER BY time DESC LIMIT 5;You will see the data which store in the influxDB as shown in the image below
Launch Grafana
- Open Grafana in your browser
http://localhost:3000Default Credentials:
- Username: admin
- Password: admin
Grafana will prompt you to set a new password on first login.
- Add InfluxDB as a Data Source
On the left sidebar, click ⚙️ (Settings) → Data Sources
Click Add data source
Select InfluxDB
Configure the connection:
Configure InfluxDB Connection
Setting Value Query Language InfluxQL URL http://127.0.0.1:8086Database aupp_labUser / Password (blank unless you configured authentication) HTTP Method GET Version 1.8+ - Create a Dashboard
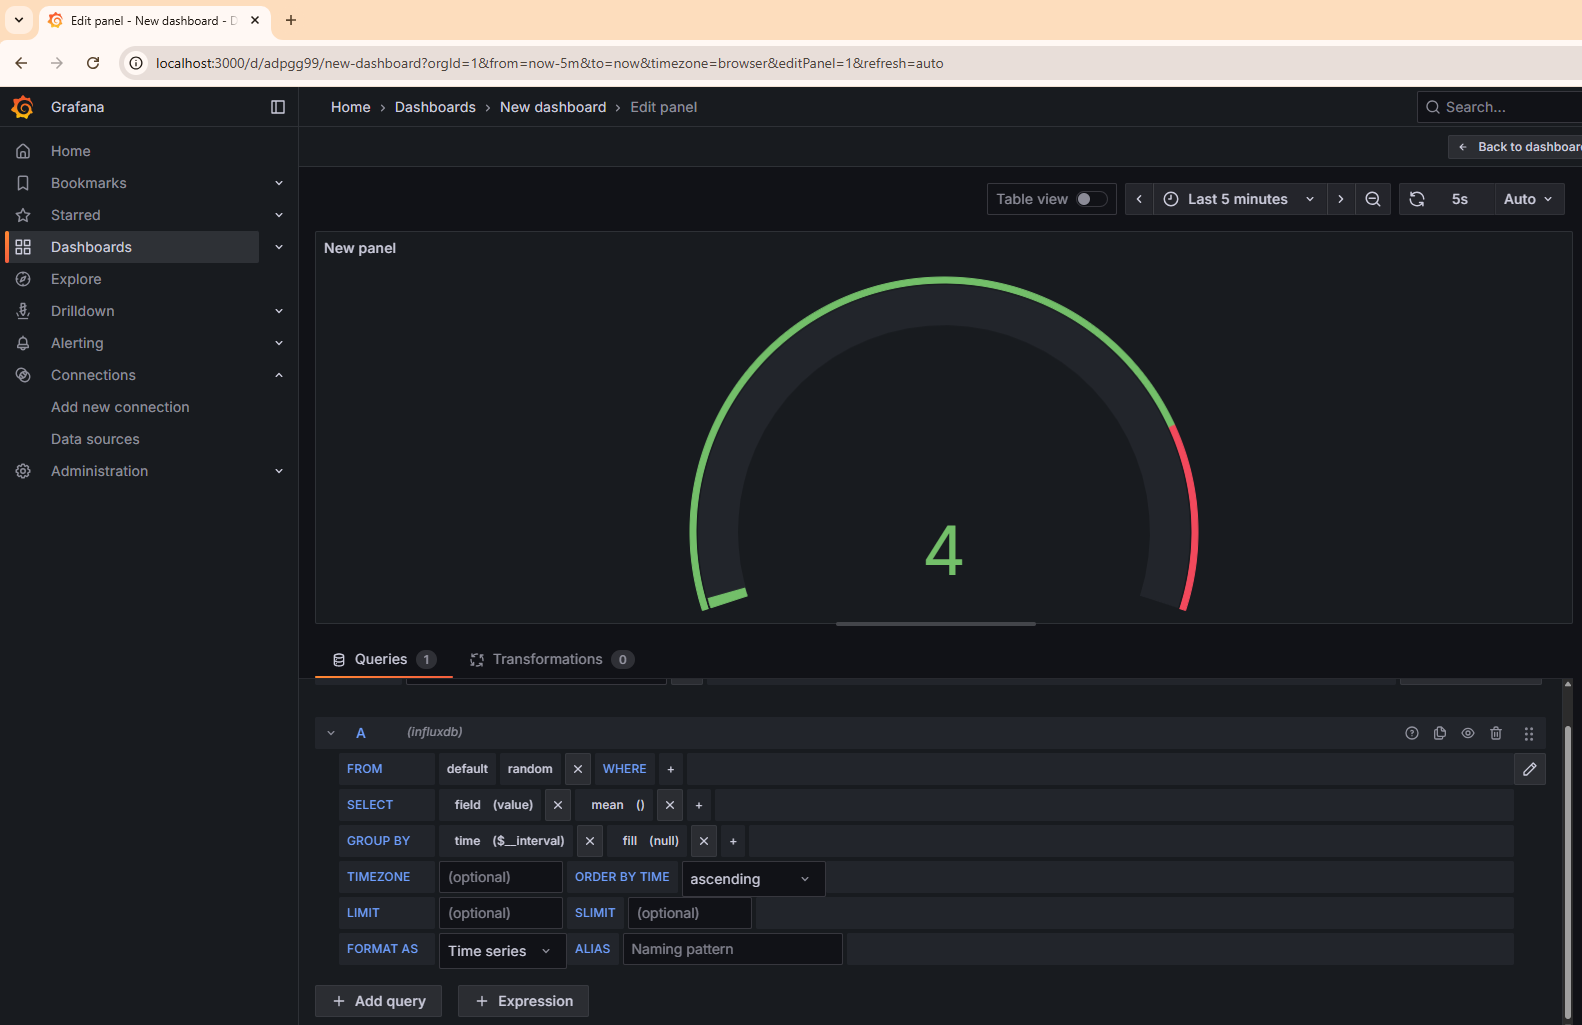
This step will guide you through creating a real-time dashboard in Grafana to visualize the ESP32 data stored in InfluxDB.
In Grafana’s left sidebar, click the “+” (Create) icon
Select Dashboard → Add new panel
Choose Your Data Source
Under Query, select your InfluxDB data source (e.g.,
InfluxDB - aupp_lab)This connects Grafana to the database where your Node-RED flow is saving data
Then you just need to change the topic to random, you will see the data is updating everytime the esp32 sending the random value